These figures show the size of the gap, how it compounds over time, and the workplace structures that keep feeding it.
National picture
79c
Across Australia, women earn 79 cents in total remuneration for every dollar men earn on average. This 21.1% total-remuneration gap represents $28,356 less per year for full-time employees, a significant loss that compounds over a lifetime.
WGEA reports a 21.1% total-remuneration gap, or $28,356 less per year for full-time employees.
Source
Manager pay
22.8%
Women managers earned 22.8% less than men managers, showing the gap persists even in leadership pathways. This indicates that the problem is not confined to entry-level or mid-level roles but extends to the highest levels of organisational responsibility.
Women are more likely to be in part-time work, which changes income, progression, and long-term security. This concentration in part-time roles often reflects care responsibilities and workplace structures that limit flexibility for women, creating a structural barrier to economic advancement.
The annual gap peaks between ages 55 and 59, when women earn about $52,000 less than men in the same age group. WGEA identifies age 34 as a critical point where the gap accelerates, suggesting that career interruptions and care responsibilities compound over time to create widening disparities in later career stages.
WGEA identifies age 34 as a critical point where the gap accelerates.
Source
State and territory snapshot
Equal Pay Day arrives later where the gap is larger
Equal Pay Day marks the additional days women must work into the new financial year to earn the same amount men earned in the previous year. States with larger gaps have later Equal Pay Days, meaning women work longer for equal pay.
State
Gap
Weekly difference
Equal Pay Day
WA
22.4%
$471.70
14 October
QLD
15.6%
$283.20
5 September
VIC
14.2%
$263.60
30 August
NSW
12.4%
$233.40
21 August
NT
12.0%
$217.90
19 August
ACT
11.3%
$237.80
16 August
TAS
7.5%
$121.60
30 July
SA
7.5%
$123.70
29 July
National
14.1%
$263.90
29 August
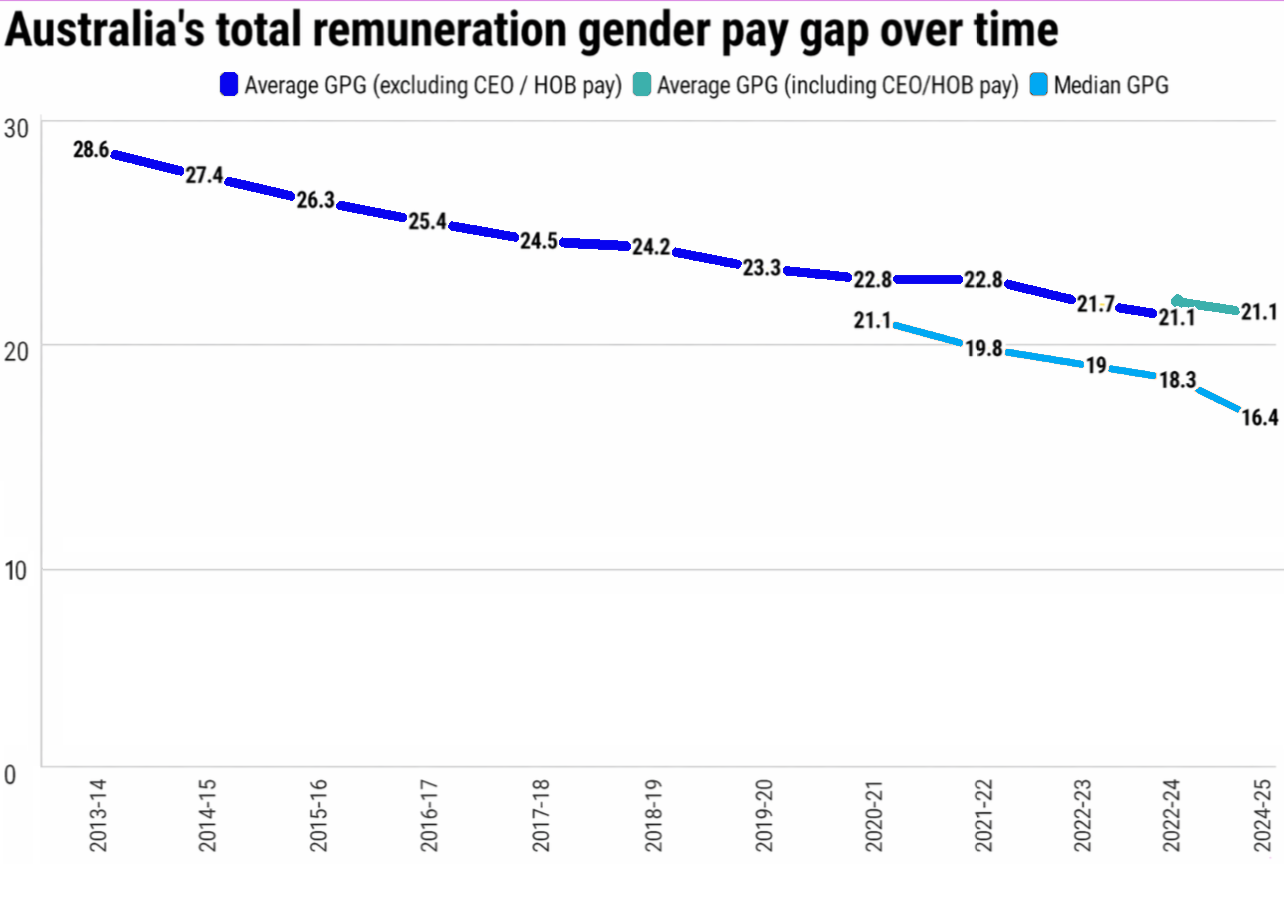
Gap over time
Australia's total remuneration gap is falling, but it has not closed
The line chart shows Australia's total remuneration gender pay gap over time. While the gap has decreased from its peak, progress has been slow and uneven. The data demonstrates that policy interventions and awareness campaigns have had some effect, but structural barriers and unconscious biases continue to maintain significant disparities in pay.